Error in plot.window(…) : need finite ‘ylim’ values in R (Example)
In this tutorial you’ll learn how to reproduce and debug the “Error in plot.window(…) : need finite ‘ylim’ values” in the R programming language.
Example Data
The data below is used to illustrate the error message.
my_x <- c(1, 3, 5, 2, 4, 6)
my_x
## [1] 1 3 5 2 4 6my_y <- c(5, 4, 5, 3, NA, 2)
my_y## [1] 5 4 5 3 NA 2Reproduce the Error Message
Let’s assume that we want to draw a plot of our data with a ylim range corresponding to the values in our variable my_y:
plot(my_x,
     my_y,
     ylim = range(my_y))
## Error in plot.window(...) : need finite 'ylim' valuesWhy the Error Message Occurrs
The R code below has returned an error message. The reason for the occurrence of this error message is that our variable my_y contains an NA value.
Once we apply the range function to this variable, not the range of our non-NA values, but two NA values are returned.
The plot function does not know how to handle these NA values, and hence, the error message is returned.
Note that the same error could appear when trying to set the x-axis limits instead of the y-axis limits using the xlim argument.
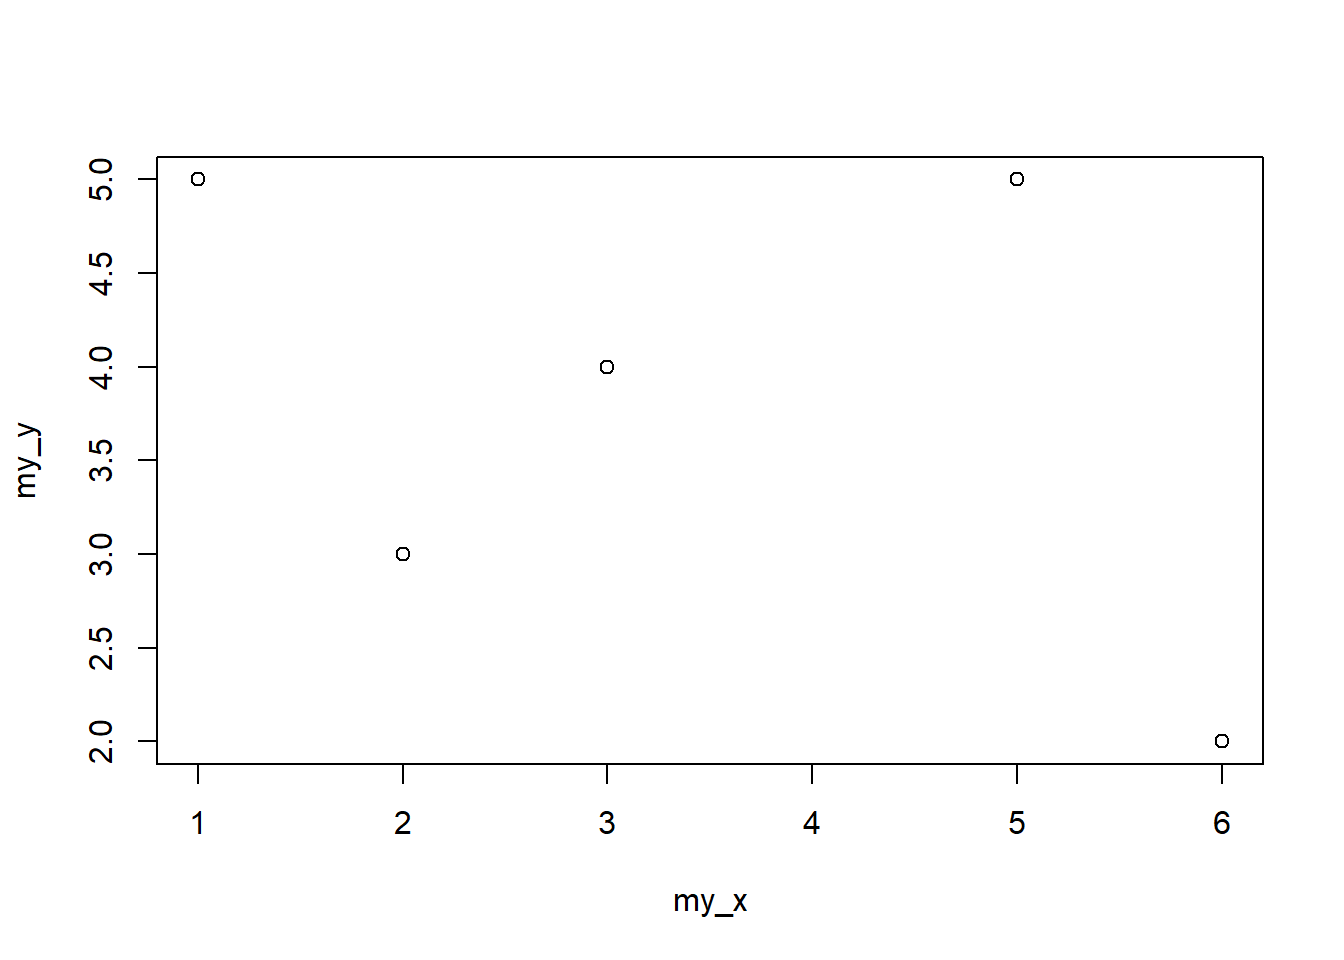
Debug the Error Message
The R code below fixes the error message.
All we have to do is to specify the na.rm argument within the range function to be equal to TRUE.
plot(my_x,
     my_y,
     ylim = range(my_y, na.rm = TRUE))